Navigation Tutorial
Lesson 1 - Map Reading
All content copyright © Ashley Burke 2008. Not to be copied, duplicated or used for any purpose without permission.
Navigation Tutorial Lesson 1 - Map Reading
All content copyright © Ashley Burke 2008. Not to be copied, duplicated or used for any purpose without permission. |
Navigation course by Ashley Burke
1. Essentials of a Topographic Map
1.1 Representing the Elevations of Landforms
A topographic map is any map which shows the elevations of landforms. To do this, a method must be used to represent the uneven three dimensional surface of the Earth on a flat two dimensional sheet of paper. One of the most visually intuitive methods of doing so is to colour regions of different elevations as in Fig 1.1.
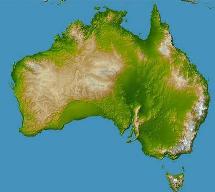 |
This map of Australia uses colours to depict different elevations. For example, dark green might represent land between 0 and 200m above sea level. Lighter green is used to represent land between 200 and 400m above sea level. Brown is used for land between 400 and 600m, and this gets successively lighter in colour in 200m increments until it is pure white for land above 1200m. |
| Fig 1.1 |
An alternative to this colour coding method is to use contour lines. It is this latter method that is used on all maps that are used for navigation. A contour line is a line on a map that joins all the points of an equal elevation. To understand this, imagine the above map with lines drawn on the map following the boundary between one colour and the next. Then remove all the colours, leaving just the lines, and you have a contour map, such as the one shown in Fig 1.2.
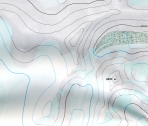 |
This map uses contour lines instead of colours to delineate elevations. The various curved lines on this map are the boundaries between one altitude range and the next. Imagine the colour coded map of Australia above with the colours removed and only the boundaries between one colour and the next delineated by a line. This method of representing elevations is much more useful because colours can then be used for other purposes, such as marking vegetation zones, cleared land, forests, grasslands, etc. |
| Fig 1.2 |
The rest of this course regards contour lines as the standard method of representing topography on a map.
1.2 Properties of Contour Lines
Contour lines display recognisable properties depending on the type of ground that they represent, and these will be discussed in detail later in this course. The following general observations can be made about all contour lines on all topographic maps:
All topographic maps indicate what the vertical displacement is between one contour line and the next. This value is called the contour interval and is consistent across the entire map. Most metric maps used for navigation have a contour interval of 10 or 20 metres. On imperial scale maps the contour interval is normally 50 or 100 feet. Knowing the contour interval allows you to read the change in elevation during a journey on the map, as Fig 1.3 shows.
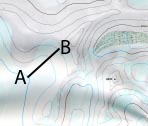 |
The contour interval on the map in Figure 1.3 is 200 metres. Therefore on a journey from A to B on this map as shown, there is a change in altitude of 400 metres, because the journey crosses two contour intervals. Later in this course you will learn how to determine whether this altitude change is uphill or downhill! |
| Fig 1.3 |
The scale of a topographic map is normally given as a ratio, and most topographic maps used for walking, trekking and mountaineering are of one of the following scales:
| Scale | Metric / Imperial | Conversion | Example Maps |
| 1:24 000 | Imperial | 1 inch to every 2000 feet | USA uses this scale in their USGS 7.5 minute series maps |
| 1:25 000 | Metric | 4cm to the km | New South Wales and Tasmanian topographic maps, French "Top 25" series, UK Ordinance Survey "OS Explorer" series |
| 1:31 680 | Imperial | 2 inches to the mile | Older New South Wales first edition sheets, some USA maps |
| 1:50 000 | Metric | 2cm to the km | New Zealand topographic maps, Swiss topographic maps, UK Ordinance Survey "OS Landranger" series |
| 1:63 360 | Imperial | 1 inch to the mile | Older New Zealand maps, some USA maps |
| 1:100 000 | Metric | 1cm to the km | Tasmanian "Tasmap" 1:100000 series, Australian "Natmap" 1:100000 series |
Scales larger than 1:24 000 or smaller than 1:100 000 are not normally useful for walkers.
People often use the scale of the map when planning a trip to work out the length of the trip in kilometres or miles. Yet in most cases it is not the distance covered but the time needed to cover it which is the most important measure. Terrain can vary greatly, as can such factors as the density of the scrub, number of creek crossings, difficulty of any climbing, steepness of slopes and of course the fitness and size of the group. These factors more greatly affect the difficulty of the trip than does the overall distance travelled. So take such factors into consideration when planning your trip and think of your trip in terms of the time needed rather than the distance to be travelled.
Web page created 12 Jul 2008, last updated 09 May 2022. All content copyright © Ashley Burke 2008. Not to be copied, duplicated or used for any purpose without permission. |
